Activity Monitor on Mac: Where It Is and How to Use It
Activity Monitor is the Mac's built-in task manager and resource monitor. It's in the Utilities folder inside Applications, and the quickest way to open it is Spotlight: press ⌘Space (Command-Space), type "Activity Monitor" and press Return. It lists every running app and background process, with how much CPU, memory, energy, disk and network each one uses.
What Activity Monitor is
Activity Monitor comes with macOS, so there's nothing to install. If you're coming from Windows, it does the job of both Task Manager and Resource Monitor: it shows what's running and what each process uses, and it lets you quit a process that misbehaves. It doesn't show temperatures or fan speeds, and it doesn't explain what each process is. More on that below.
How to open Activity Monitor
1. Spotlight
- Press ⌘Space.
- Type "activity". It usually comes up after a few letters.
- Press Return.
2. Finder
- Click Finder in the Dock.
- Choose Go › Utilities, or press ⇧⌘U (Shift-Command-U).
- Double-click Activity Monitor.
This is the same folder as Applications › Utilities.
3. Apps or Launchpad
On macOS Tahoe, click Apps in the Dock, which replaced Launchpad, and type "activity". On macOS Sequoia, open Launchpad and look in the Other folder, or type its name.
4. The Dock
While Activity Monitor is open, Control-click (or right-click) its icon in the Dock and choose Options › Keep in Dock. After that, it's always one click away.
The five tabs
Across the top of the window are five tabs: CPU, Memory, Energy, Disk and Network. Each lists the same processes with different columns. Click a column heading to sort, and click it again to reverse the order. The panel at the bottom of each tab shows totals for the whole Mac. If Content Caching is turned on, a Cache tab appears as well.
CPU
Shows how much processor time each process uses. The bottom panel splits the total into System, User and Idle, next to a CPU Load graph. Mostly idle is normal when you aren't doing much. For a graph of each core, choose Window › CPU History (⌘3). For graphics, choose Window › GPU History (⌘4).
Memory
Shows how much RAM each process holds. The Memory Pressure graph at the bottom is the figure to watch: green means there's enough memory, yellow means macOS is compressing memory to make room, and red means it's moving data to the startup disk as swap, which slows everything down. A Memory Used figure close to Physical Memory is normal, because macOS keeps recently used files in spare memory. How to check memory usage on Mac explains every number in this panel.
Energy
Shows how much power each app draws, which is what you want on a MacBook running on battery. The Preventing Sleep column shows apps that keep the Mac awake, and App Nap shows which apps macOS has slowed down while they're out of sight. On a laptop, the bottom panel shows the battery charge over the last 12 hours.
Disk
Bytes Written and Bytes Read show how much data each process has written and read. Heavy reading after a macOS update is usually Spotlight rebuilding its index with mds_stores and mdworker_shared.
Network
Sent Bytes and Rcvd Bytes show which processes use the network, which helps when something uploads in the background. iCloud Drive syncing shows up here as cloudd.
The columns worth knowing
| Column | Tab | What it tells you |
|---|---|---|
| % CPU | CPU | Share of processor time right now. 100% is one full core, so a busy app on a Mac with many cores can show 300% or more. |
| CPU Time | CPU | Total processor time since the process started. A large number on a process you rarely use means it works in the background. |
| Threads | CPU, Memory | How many threads the process runs. Browsers and creative apps run hundreds, which is normal. |
| Idle Wake Ups | CPU | How often the process wakes the processor from rest. High numbers cost battery life. |
| Kind | CPU | On Apple silicon, Apple for native apps and Intel for apps running through Rosetta, which use more processor time. |
| Memory | Memory | How much memory the process uses. |
| Compressed Memory | Memory | How much of that memory macOS has compressed to make room. Add it with View › Columns. |
| Energy Impact | Energy | A relative measure of the power the app draws right now. Lower is better. |
| 12 hr Power | Energy | Average Energy Impact over the last 12 hours, or since the Mac started. |
Find, filter and inspect processes
- Search. Type in the search field in the toolbar, or press ⌥⌘F (Option-Command-F), to show only processes whose name matches.
- Filter. The View menu sets which processes appear: All Processes, My Processes, System Processes, Windowed Processes, Applications in last 12 hours and more. All Processes, Hierarchically shows which process started which.
- Inspect. Double-click a process, or select it and press ⌘I (Command-I). The inspector shows its parent process, memory figures, and the files and ports it has open.
- Update speed. View › Update Frequency sets how often the numbers refresh: every 1, 2 or 5 seconds.
How to quit a process in Activity Monitor
- Select the process.
- Click the Stop button (an X) in the toolbar, or choose View › Quit Process (⌥⌘Q).
- Click Quit to ask it to close normally, or Force Quit to end it immediately.
Activity Monitor warns you before you quit something important, for example that quitting WindowServer will log you out. Take those warnings seriously. kernel_task can't be quit at all, and macOS can't run without launchd. For a stuck app, the Force Quit window (⌥⌘⎋) is often quicker: see how to force quit on Mac.
Keep it in the Dock and show CPU in the icon
Once Activity Monitor is in the Dock, its icon can show live activity instead of the app icon. Choose View › Dock Icon and pick one:
- Show CPU Usage: bars for the current processor load.
- Show CPU History: a small graph of recent load.
- Show Network Usage or Show Disk Activity: a graph of that traffic.
- Show Application Icon: the normal icon.
The Dock icon keeps updating while the app runs, even after you close its main window with ⌘W (Command-W). Choose Window › Activity Monitor (⌘1) to bring the window back. Window › CPU Usage (⌘2) opens a small floating meter, and Window › Keep CPU Windows on Top keeps it above your other windows. That's the easiest way to monitor activity on your Mac while you work.
What Activity Monitor doesn't tell you
Activity Monitor is accurate and free, but it has limits.
- No temperatures or fan speeds. macOS doesn't show them anywhere. See how to check your Mac's temperature.
- Cryptic names. It shows names like photoanalysisd, corespotlightd or fileproviderd, but not what they do or whether they're safe to quit.
- Little history. Apart from the Energy tab's 12-hour figures, you can't look back at what slowed the Mac down an hour ago.
- No alerts. It won't tell you when an app gets stuck at high CPU or memory runs low.
Activity Monitor with explanations
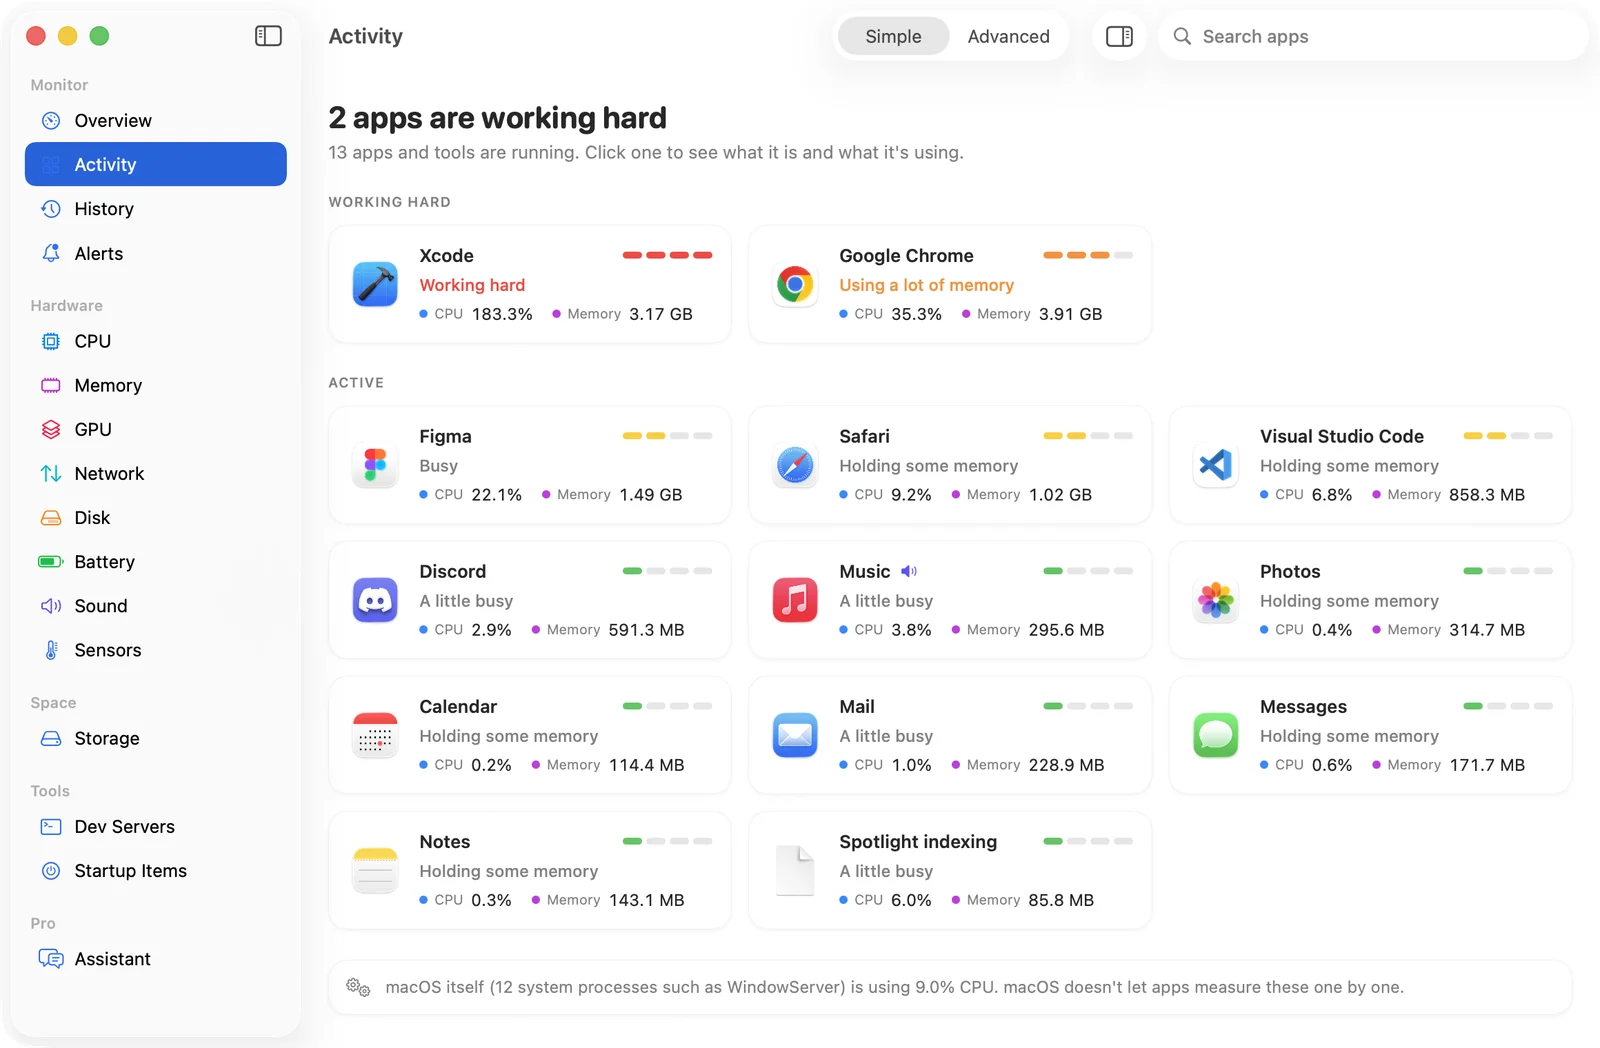
SystemWatch is a native Mac task manager built around those gaps. Its Activity view gives every app and process a plain-language note, it keeps 24 hours of history, and it sends an alert when an app keeps working hard or memory runs low. The App Store edition covers the monitoring, with a subscription for extras.
The website edition adds what App Store rules don't allow: Quit, Force Quit, Pause and priority controls, every temperature sensor and fan control. It's a one-time $5.99 license for the first 100 copies, then $14.99.