Task Manager for Mac: Activity Monitor and SystemWatch
Your Mac has a task manager. It's called Activity Monitor, and it comes with macOS. To open it, press ⌘Space (Command-Space), type "Activity Monitor" and press Return. If you only need to close a frozen app, the Mac's version of Ctrl-Alt-Delete is ⌥⌘⎋ (Option-Command-Escape), which opens the Force Quit window.
How to open Activity Monitor
With Spotlight
- Press ⌘Space.
- Type "activity". It usually comes up after a few letters.
- Press Return.
From Finder
- Click Finder in the Dock.
- Choose Go › Utilities, or press ⇧⌘U (Shift-Command-U).
- Double-click Activity Monitor.
This is the same folder as Applications › Utilities.
From the Dock
While Activity Monitor is open, Control-click (or right-click) its icon in the Dock and choose Options › Keep in Dock. Next time it's one click away. Under View › Dock Icon, you can make that icon show live CPU, disk or network activity.
What each tab means
Activity Monitor has five tabs. Each one lists processes: the apps you opened plus the background programs that macOS and your apps run. Click a column heading to sort, so the busiest process is at the top.
CPU
The % CPU column shows how much processor time each process uses. 100% means one full core, so a busy app on a Mac with many cores can show 300% or more. The panel at the bottom splits use into System, User and Idle. Mostly idle is normal when you aren't doing much. On Apple silicon, the Kind column shows whether an app runs natively ("Apple") or through Rosetta ("Intel").
Memory
The Memory column shows how much RAM each process holds. The graph at the bottom, Memory Pressure, is the number to watch. Green means there's enough memory. Yellow means macOS is compressing memory to make room. Red means the Mac needs more than it has and is moving data to disk (Swap Used goes up), which slows everything down. A high Memory Used figure on its own is fine, because macOS keeps recently used files in memory.
Energy
Energy Impact is a relative measure of how much power an app draws right now, and 12 hr Power averages it over the last 12 hours. The Preventing Sleep column shows apps that keep the Mac awake. This tab matters most on a MacBook running on battery.
Disk
Bytes Written and Bytes Read show which processes use the drive. Heavy reading after a macOS update is usually Spotlight rebuilding its index (mds_stores).
Network
Sent Bytes and Rcvd Bytes show which processes use the network, which helps when something is uploading in the background. For graphics, choose Window › GPU History.
Quitting a process
Select it, click the Stop button (an X) in the toolbar, then choose Quit or Force Quit. Be careful with names you don't recognize. Many belong to macOS: quitting WindowServer logs you out, and kernel_task can't be quit at all. Our force quit guide covers every method.
Where Activity Monitor stops
Activity Monitor is reliable, and it's free. It also has limits. It shows a name like photoanalysisd but not what it does or whether it's safe to quit. It keeps no history once you close it, so you can't see what happened an hour ago. It doesn't warn you when an app is stuck at high CPU or memory runs out. And it shows no temperatures or fan speeds.
SystemWatch: a task manager that explains itself
SystemWatch is a native Mac app built around those gaps.
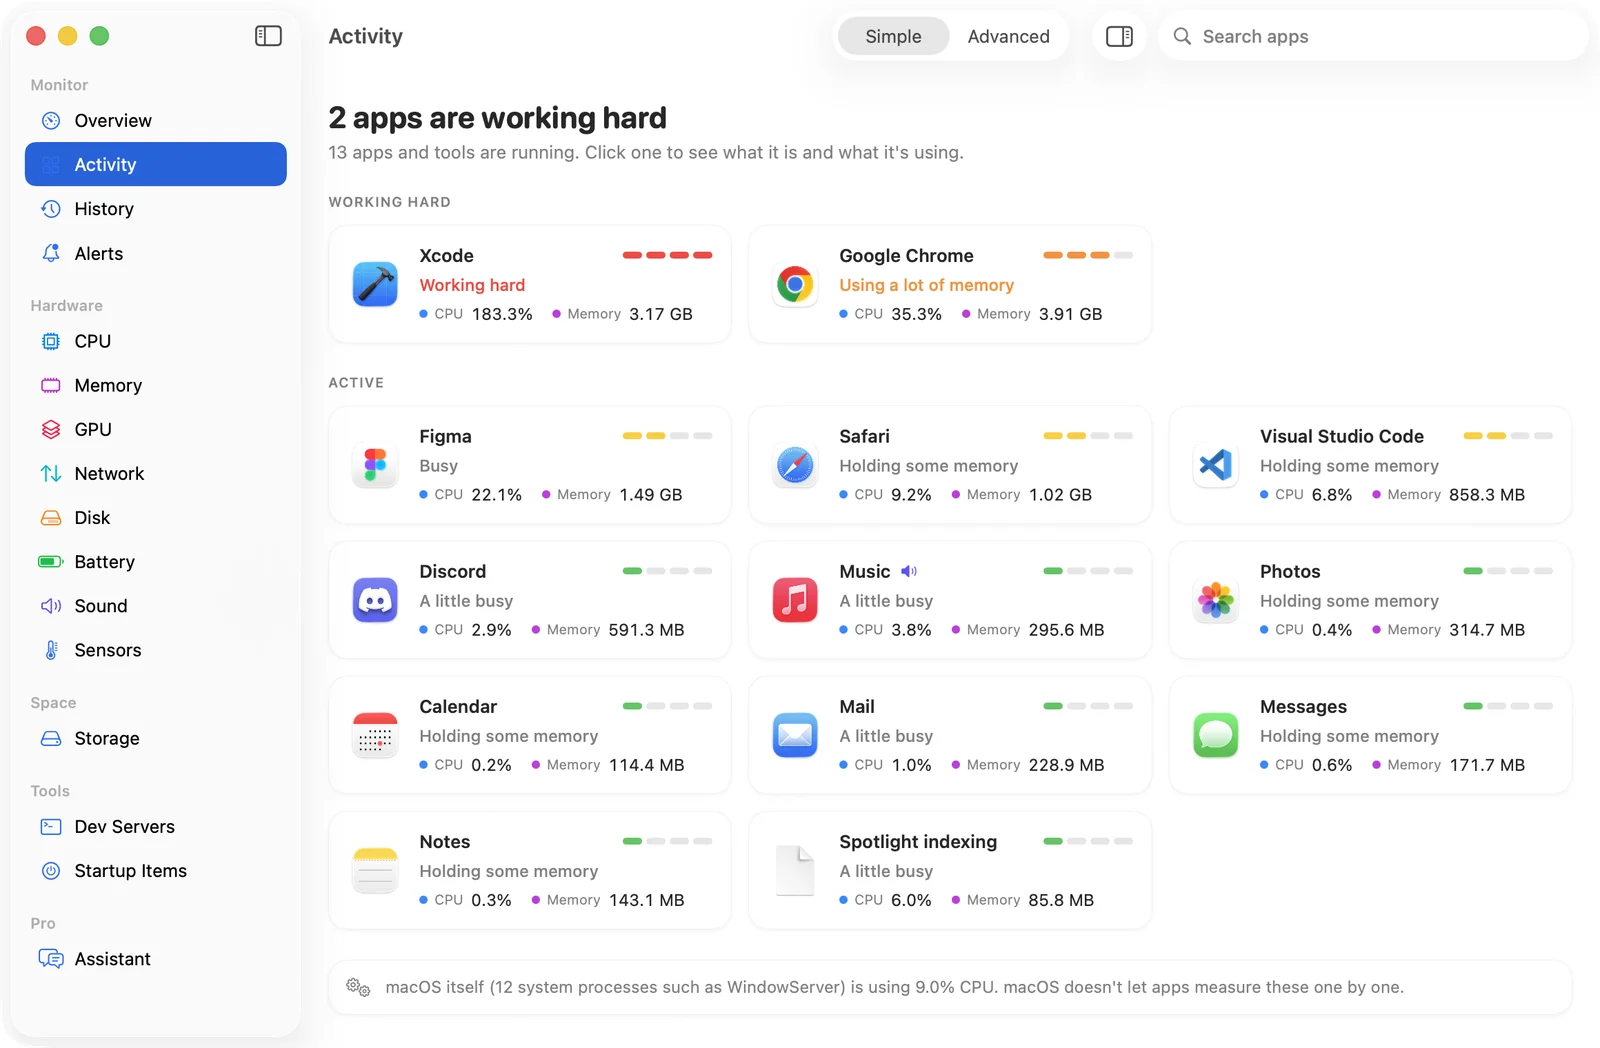
- Every process explained. The Activity view gives each app and process a plain-language note: what it is, why it might be busy and whether it's safe to quit.
- Everything in one place. CPU, memory, GPU, disk, network, battery and sound, in a window and in a menu bar panel. You can also put single metrics in the menu bar.
- Alerts that say why. You get a notification when an app keeps working hard for minutes, when one app uses a lot of memory, when memory runs low, when the disk is almost full, or when the battery is low, with the app draining it most.
- History. 24 hours of history, so you can see when a slowdown started.
- Storage and dev servers. A Storage scan shows what fills your disk, and the Dev Servers view lists local development servers with the project each one runs from.
Two editions
App Store edition. Monitoring is free. SystemWatch Pro ($49.99 a year or $5.99 a month, each with a 3-day free trial) adds Bob the AI assistant, AI explanations, one-click cleanup with undo, custom alerts and 30 days of history. App Store rules don't let it quit other apps or read temperatures and fans, so it shows you which app is the problem and you quit it with ⌘Q (Command-Q).
Website edition. A one-time $5.99 lifetime license (launch price for the first 100 copies, then $14.99) for up to 3 Macs. It adds what the App Store doesn't allow: quit and force quit, pause and resume apps, and change their priority. It shows the files and network connections each app has open, and how much network and disk each app uses. It also reads every temperature sensor, controls fans and manages startup items. AI works with your own key from the provider you choose.
Both editions need macOS 15 or later and run on Apple silicon and Intel Macs. Monitoring data stays on your Mac.